By: Logan Griffiths
All NBA teams go through ups and downs throughout the long 82-game regular season; this is completely normal. However, let’s take a dive into how teams are truly performing and how they stack up against one another.
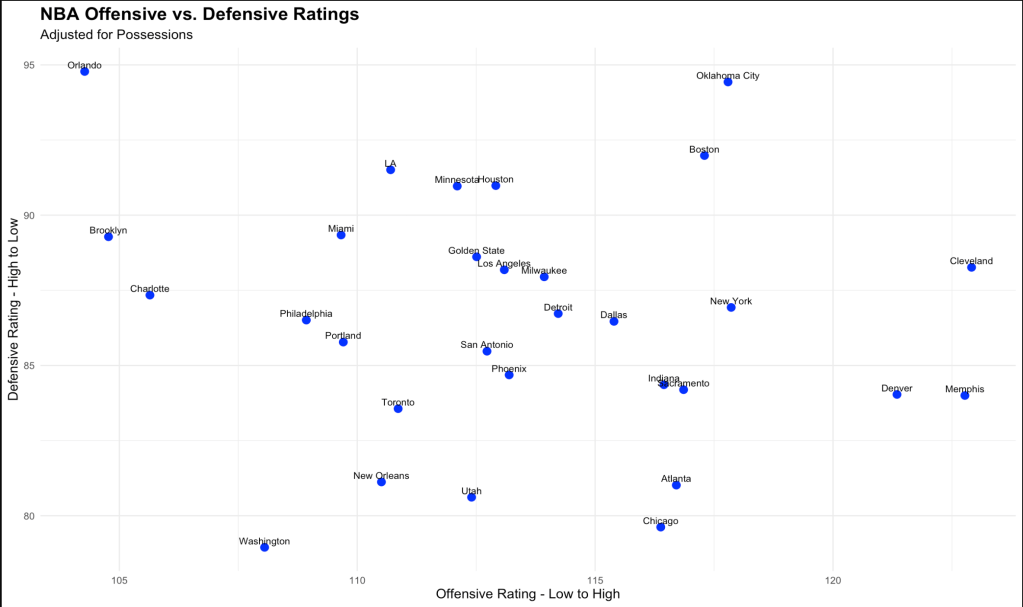
First, what metrics are we using to decide whether a team is consistent? First, it is offensive rating and defensive rating. Offensive rating is determined by shot points per 100 possessions while factoring in defensive strengths in each metric, including paint, midrange and 3-point versus the teams they faced. Additionally, the defensive rating focuses on steals, blocks, points allowed per 100 possessions.
To represent this, we show a dot plot chart that represents the defensive and offensive rating of each team on an X and Y axis. The higher you are on the graph, the better defensively you are, and the farther right you are on the graph, the better you are on offense.
Furthermore, we were able to dissect this to show consistency throughout the NBA season by finding the average of the two metrics per five games.
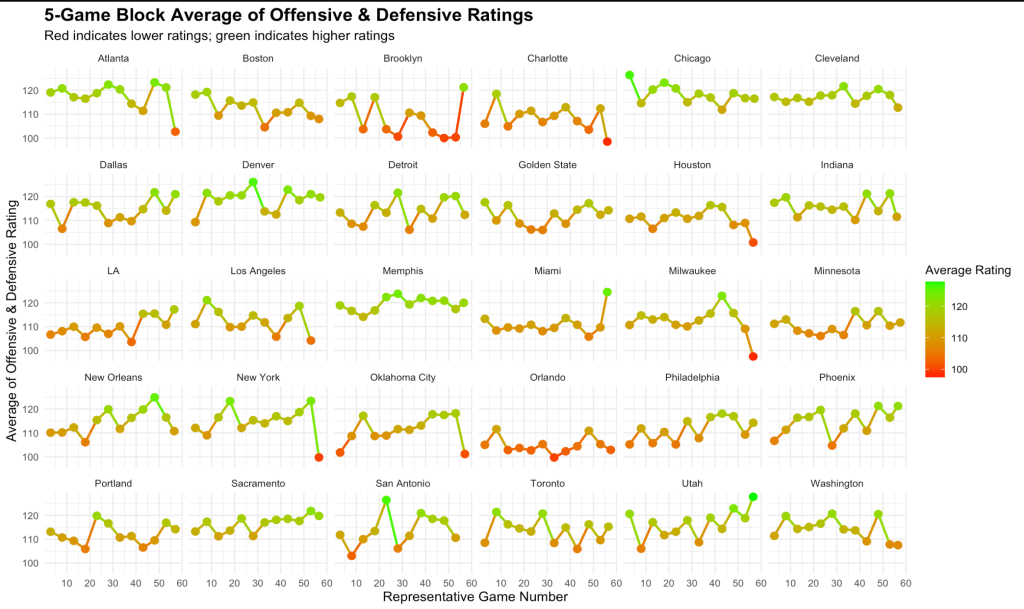
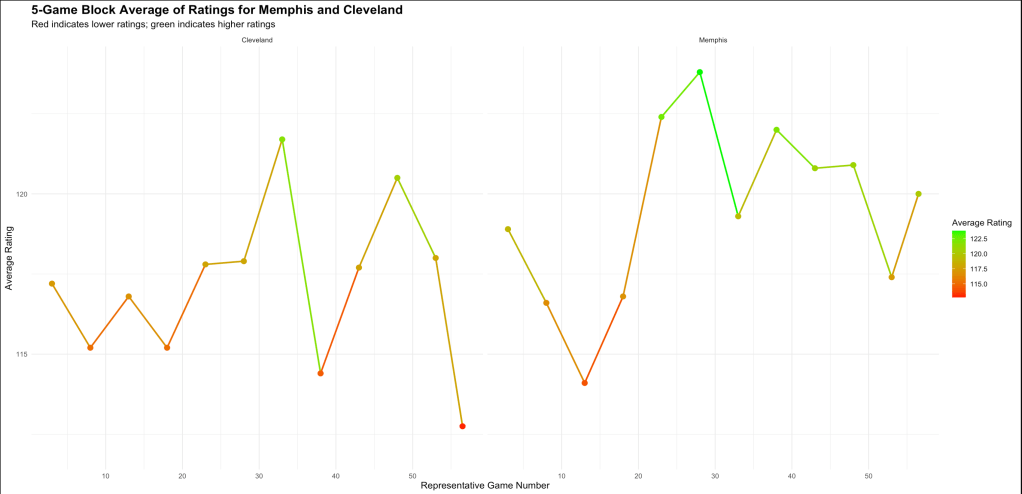
This graph shows the most consistent teams based off their five game stretches with further conclusion we can see that Memphis and Cleveland are by far the most consistent teams.
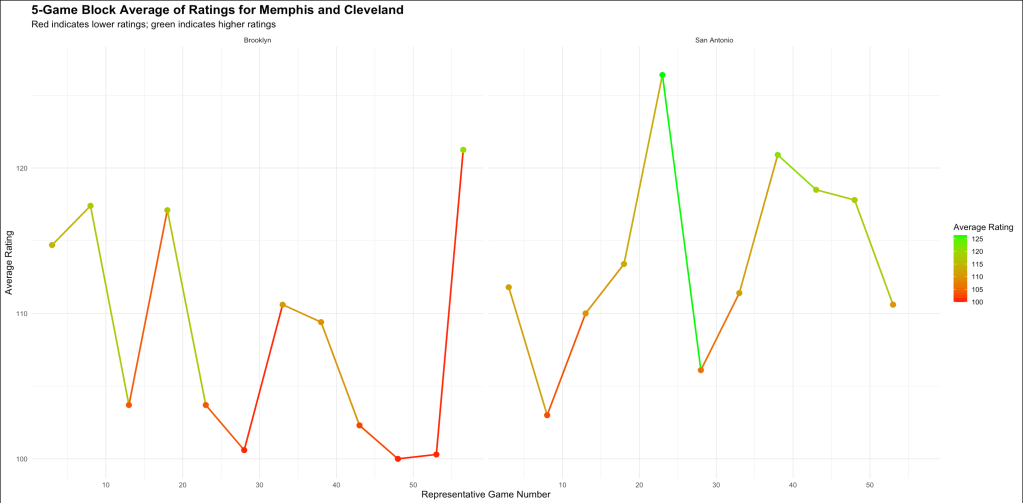
On the other hand the two most consistent teams are Brooklyn and San Antonio which have had numerous points where they peak then instantly drop down again.
In conclusion, consistency is key to success in the NBA’s long 82-game season. The data shows this pretty clearly, with Memphis and Cleveland being the most stable teams based on their five-game stretches. They’ve maintained steady offensive and defensive ratings throughout the season.
On the flip side, Brooklyn and San Antonio have been all over the place, with big peaks followed by sudden drops. This tells us that while having talent is important, being able to perform consistently game after game is what really separates the good teams from the struggling ones as we get closer to the playoffs.

Leave a comment